Monitoring Proxmox With Prometheus and Grafana
Proxmox itself has a very good interface to monitor all kinds of resources like virtual machines, containers and storages. Because I use prometheus and grafana for other services, I decided to also use it for proxmox. Let's dive right into the installation.
Note: This tutorial was written for Proxmox 7. While most of the commands should't change, there may be some differences between major versions. If you encouter any problems while following the tutorial, contact me and I will update the tutorial.
Install prometheus #
Step 1: Create a user #
First of all we create a dedicated user for prometheus. This way we have a better encapsulation of the services.
groupadd --system prometheus
useradd -s /sbin/nologin --system -g prometheus prometheus
This user does not need any shell, that's why we added the -s /sbin/nologin flag.
Step 2: Create directories for data and configuration #
Next, we create the required folders for Prometheus in order to store data and configuration files.
mkdir /var/lib/prometheus
for i in rules rules.d files_sd; do mkdir -p /etc/prometheus/${i}; done
Step 3: Download and install prometheus #
Now we are ready to download the latest release of Prometheus directly from Github.
mkdir -p /tmp/prometheus && cd /tmp/prometheus
curl -s https://api.github.com/repos/prometheus/prometheus/releases/latest \
  | grep browser_download_url \
  | grep linux-amd64 \
  | cut -d '"' -f 4 \
  | wget -qi -
We have to extract the file and move all files to the correct directory.
tar xvf prometheus*.tar.gz
cd prometheus*/
mv prometheus promtool /usr/local/bin/
mv prometheus.yml  /etc/prometheus/prometheus.yml
mv consoles/ console_libraries/ /etc/prometheus/
Cleanup the /tmp directory.
cd ~/
rm -rf /tmp/prometheus
Step 4: Create a systemd configuration file #
We want to manage Prometheus with systemd. Therefore we have to create a config file using the following command.
tee /etc/systemd/system/prometheus.service<<EOF

[Unit]
Description=Prometheus
Documentation=https://prometheus.io/docs/introduction/overview/
Wants=network-online.target
After=network-online.target

[Service]
Type=simple
User=prometheus
Group=prometheus
ExecReload=/bin/kill -HUP $MAINPID
ExecStart=/usr/local/bin/prometheus \
  --config.file=/etc/prometheus/prometheus.yml \
  --storage.tsdb.path=/var/lib/prometheus \
  --web.console.templates=/etc/prometheus/consoles \
  --web.console.libraries=/etc/prometheus/console_libraries \
  --web.listen-address=0.0.0.0:9090 \
  --web.external-url=

SyslogIdentifier=prometheus
Restart=always

[Install]
WantedBy=multi-user.target
EOF
Once you did this, set the correct file permissions and start Prometheus.
for i in rules rules.d files_sd; do chown -R prometheus:prometheus /etc/prometheus/${i}; done
for i in rules rules.d files_sd; do chmod -R 775 /etc/prometheus/${i}; done
chown -R prometheus:prometheus /var/lib/prometheus/
systemctl daemon-reload
systemctl start prometheus
systemctl enable prometheus
This is all we have to do in order to get Prometheus up and running. In the next step we install and configure the proxmox-pve-exporter.
Install proxmox-pve-exporter #
As the name already indicates, the proxmox-pve-exporter scrapes data from the proxmox api and provides it to prometheus.
Step 1: Install proxmox-pve-exporter #
If you haven't it already installed, install python and pip using the following command.
apt install python3 python3-pip
Once this command has finished we are ready to install the proxmox-pve-exporter via pip.
pip3 install prometheus-pve-exporter
Step 2: Create an authentication file #
In order for proxmox-pve-exporter to connect to the Proxmox api we need to create a file with the credentials.
nano /etc/prometheus/pve.yml
Paste the following lines into the file and be sure to replace the credentials with yours.
default:
    user: user@pve
    password: your_password_here
    verify_ssl: false
Note: If you encounter any issue with authentication, please refer to the proxmox-pve-exporter docs.
https://github.com/prometheus-pve/prometheus-pve-exporter#authentication
Step 3: Create a systemd configuration file #
Like in the first chapter we need to create a systemd config file to control proxmox-pve-exporter.
tee /etc/systemd/system/prometheus-pve-exporter.service<<EOF
[Unit]
Description=Prometheus exporter for Proxmox VE
Documentation=https://github.com/znerol/prometheus-pve-exporter

[Service]
Restart=always
User=prometheus
ExecStart=/usr/local/bin/pve_exporter /etc/prometheus/pve.yml

[Install]
WantedBy=multi-user.target
EOF
Enable the service by running the following commands.
systemctl daemon-reload
systemctl start prometheus-pve-exporter
systemctl enable prometheus-pve-exporter
Step 4: Add proxmox-pve-exporter to prometheus #
Now we have to add proxmox-pve-exporter to prometheus.
nano /etc/prometheus/prometheus.yml

- job_name: 'proxmox'
  metrics_path: /pve
  static_configs:
  - targets: ['localhost:9221']
Save the file and restart prometheus.
systemctl restart prometheus
Install grafana #
In all previous steps we started collecting data from our system. Now we need to install grafana to get a beautiful overview of all the data.
Step 1: Install Grafana #
First of all, add the following line to /etc/apt/sources.list.d/grafana.list
deb https://packages.grafana.com/oss/deb stable main
Now we have to install the proper key.
curl https://packages.grafana.com/gpg.key | apt-key add -
Update the apt index and install grafana.
apt update && apt install -y apt-transport-https grafana
Once grafana was installed, enable it and check if it is running.
systemctl enable --now grafana-server
systemctl status grafana-server.service
Step 2: Test the installation #
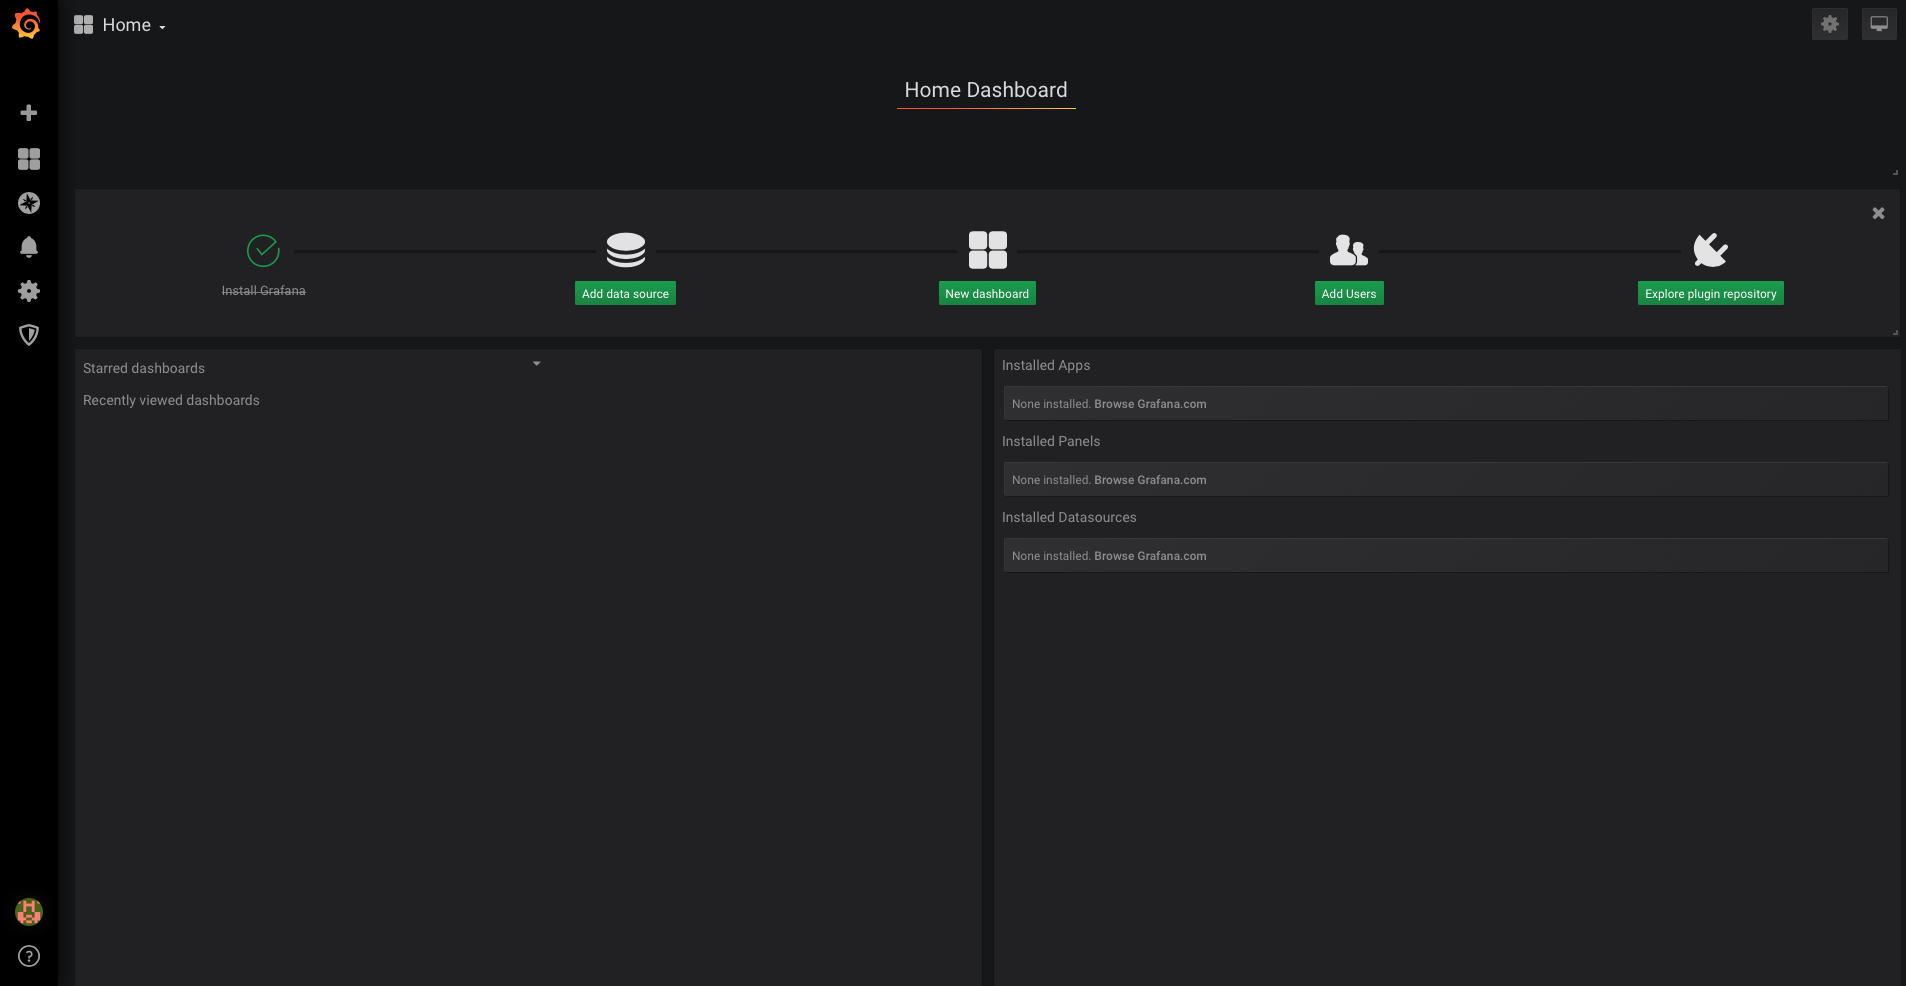
Grafana was successfully installed. Open up your browser and navigate to http://ipaddress:3000 and login with the default credentials.
username: admin
password: admin
Step 3: Add the Prometheus data source #
After logging into grafana, click on "Add data source".
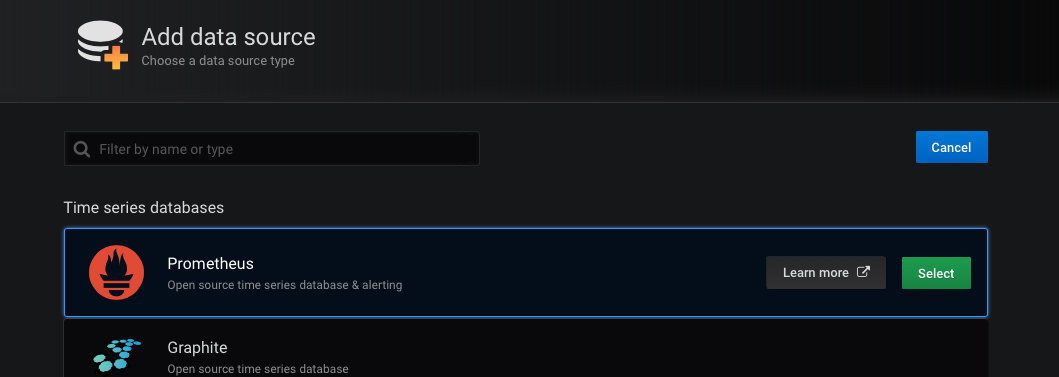
Select "Prometheus" as template.
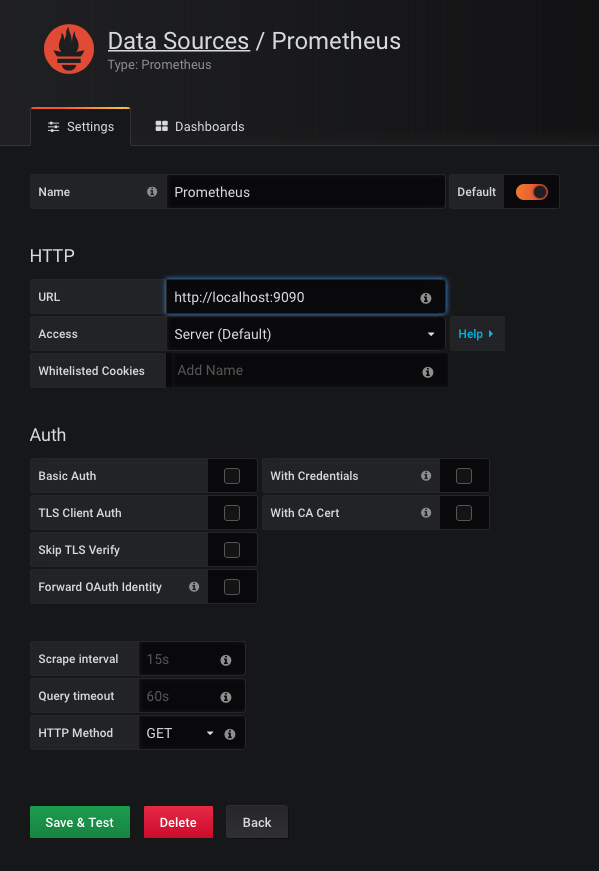
When adding the data source, be sure to select the URL from the dropdown. Click on "Save & Test".
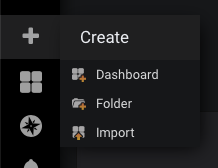
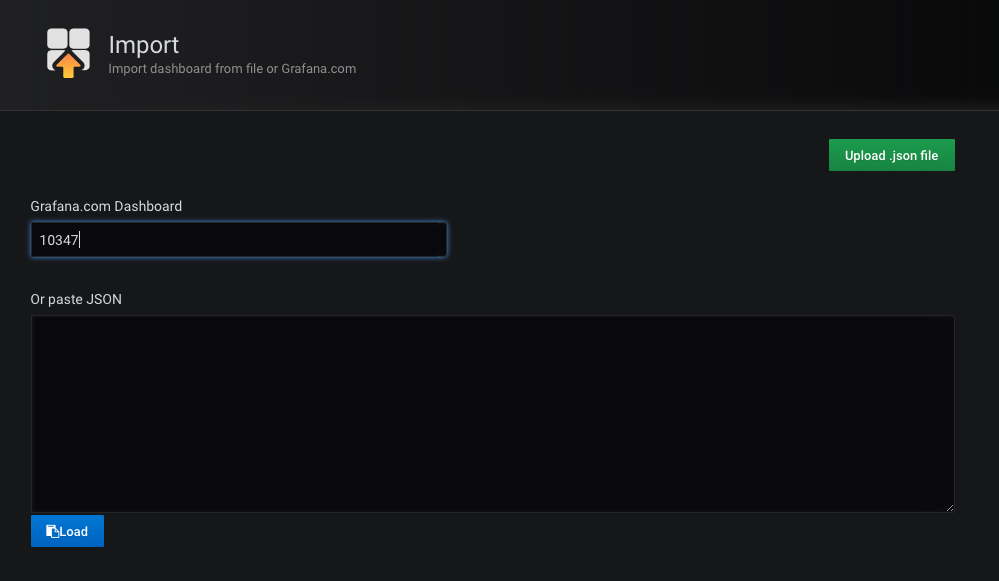
Next, navigate to the sidebar select "Create" -> "Import".
In this step, Grafana asks you for a dashboard. Luckily, Pietro Saccardi already created a nice dashboard that we can use to display our data. Paste in the dashboard id (10347) and click on "Load".
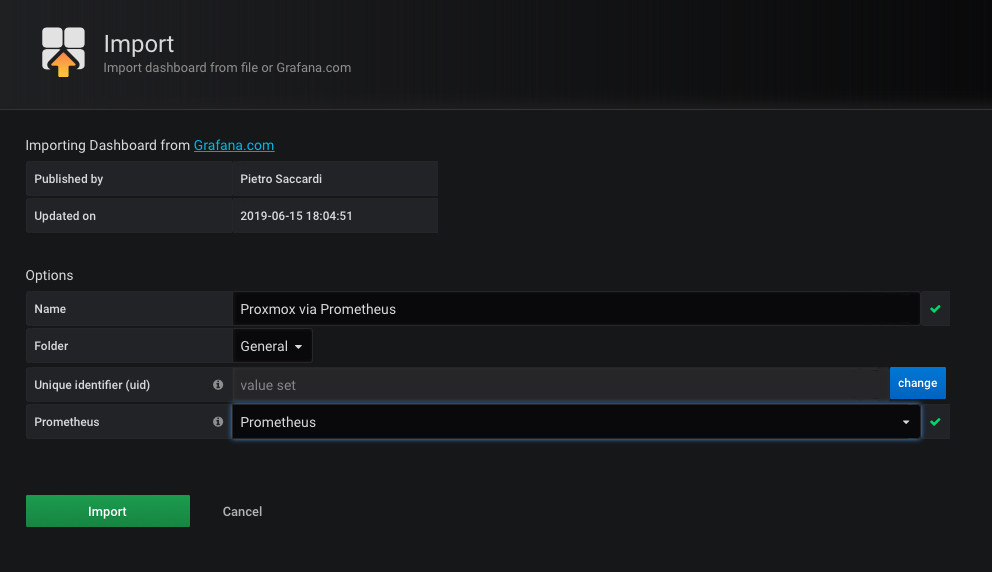
In the last step, select "Prometheus" from the dropdown menu and click on "Import".
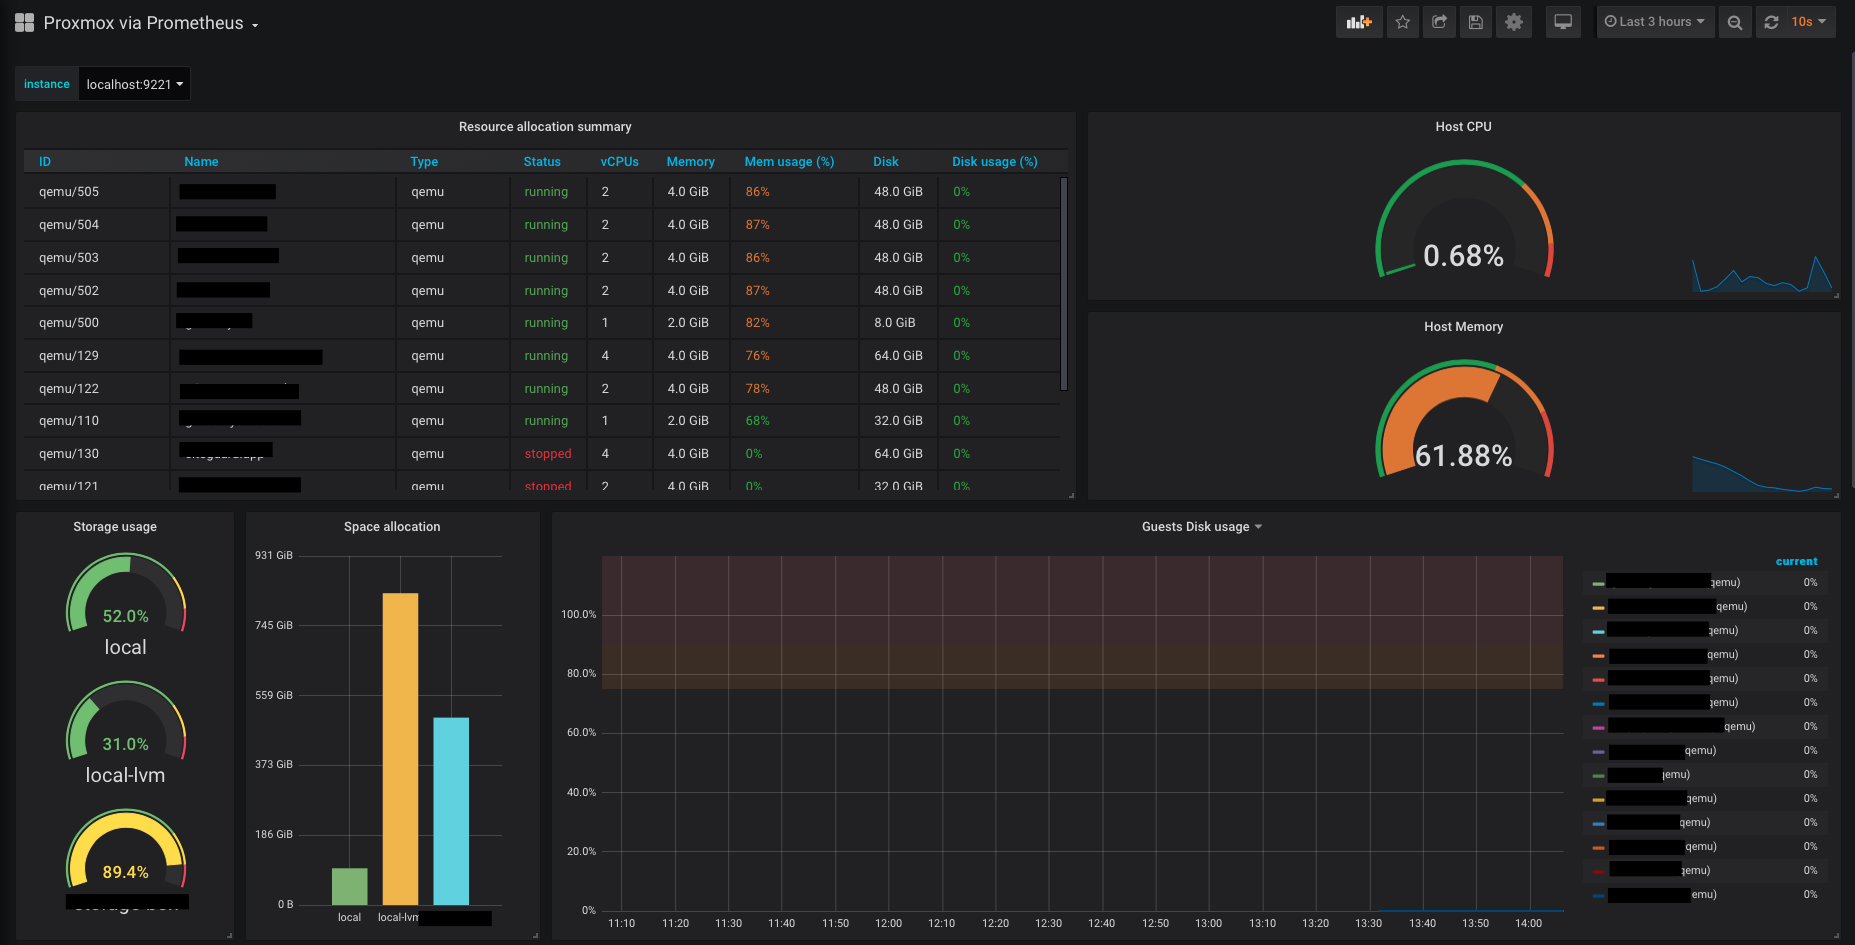
And this is what our new Grafana dashboard look like! Isn't it nice?
Security #
One thing you may noticed while reading this blog post is the following. We have a couple of endpoints that are available for everyone using a webbrowser. Although these endpoints do not leak highly sensitive information, I encourage you to block these ports for the rest of the world using a firewall like ufw.
Conclusion #
With not too much effort we were able to install a beautiful monitoring dashboard using Prometheus, proxmox-pve-exporter and Grafana. Special thanks goes to Pietro Saccardi, who built this amazing Grafana dashboard (which saves us a lot of work!).
If you have any questions or problems following this post, please feel free to contact me.